LIBS Info: Understanding: LIBS Detection Limits
LIBS Detection Limits
When I worked for Laser Analysis Technologies, our brochure contained the following detection limits table.
These are difficult to find these days - not the least because detection limits are strongly dependent on the material and the equipment - and were very prone to give Customers unreasonable expectations about the possible performance of LIBS on their samples/application.
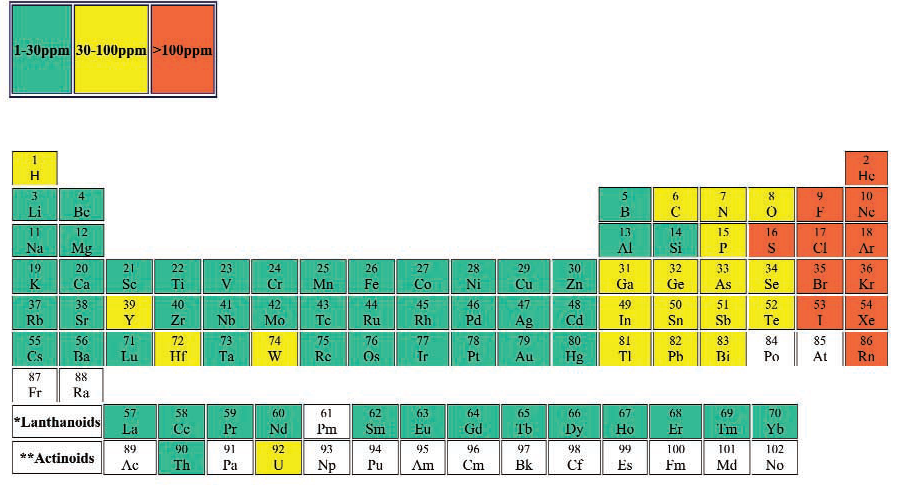
The Periodic Table below shows the median detection limit from all the papers on this site [currently 163 papers with detection limits]. While the small number of values for some elements make establishing a trend difficult, the detection limits in the top right of the periodic table are definitely highest.
The trend is not much clearer for the RMSE values, although the highest RMSE values are in the top right of the table.
In an earlier blog the effect of temperature on the emission of neutral lines is explored. In this edition, we will look at the 4 different elements - Li, B, Cu and Cl to understand the factors that influence their detection.
The emission from all the elements follows the same formula
$$ \begin{aligned} I=a C \frac{g_{k} A_{ki}}{U(T)} e^{- \frac{E_{k}}{kT}} \end{aligned} $$
where C is determined by the Saha-Boltzmann equation
$$ \begin{aligned} n_e \frac{n_i}{n_a} = 2 \frac{ \left ( 2 \pi m_e k T \right )^{ \frac{3}{2} }}{h^3} \frac{U_i(T)}{U_a(T)} e^{-\frac{E_{ion}}{kT}} \end{aligned} $$