LIBS Info: Tutorial 1: Introduction to Laser Induced Breakdown Spectroscopy
Laser Induced Breakdown Spectroscopy (from here on referred to by the common acronym, LIBS) is a powerful tool for the chemical analysis of solid, liquid and gas samples. In this, and the following documents, we will explore the technique.
This first tutorial establishes some of the key equations and concepts that we will use throughout the rest of the series. If formula derivations are not your interest you can skip to the next section
As is described elsewhere, all LIBS analysis is based on the following equation:
$\begin{aligned} I = \alpha \frac{8 \pi h c}{\lambda^3} e^{\frac{-(E_k - E_i)}{kT}} \left ( 1-exp\left [ -\frac{\sqrt{ln2}}{4 \pi \sqrt{\pi}} \frac{\lambda^2}{\Delta \nu_D} \frac{g_k A_{ki} N}{U(T))} e^{\frac{-E_i}{kT}} K(a,x)) \right ] l \right ) \end{aligned} $$ where $$\begin{aligned} I &=Intensity \\ \alpha &=scaling\quad factor \\ T &=temperature \\ U(T) &= partition\quad function \\ A_{ki} &= Einstein \quad Coefficient \quad for \quad the \quad transition \\ g_{k} &= Lower\quad level \quad degeneracy \\ E_{k} &= Upper\quad level \quad energy \\ E_{i} &= Lower\quad level \quad energy \\ k &=Boltzmann's \quad constant \\ \Delta \nu_D &= Doppler \quad linewidth\\ N &= Number \quad of \quad atoms \quad of \quad the \quad element \quad in \quad plasma/sample\\ K &= Lineshape \\ l &= absorption \quad path \quad length ( \quad that \quad is, \quad plasma \quad size)\\ K(a, x) &= Shape \quad of \quad the \quad peak, \quad where \quad a \quad is \quad the \quad gaussian \quad width \quad and \quad x \quad is \quad the \quad lorentzian \quad width\\ \end{aligned} $
Collecting together constants (to simplify things a little)
$ \begin{aligned} I = X e^{\frac{-(E_k - E_i)}{kT}} \left ( 1-exp\left [ Y \frac{g_k A_{ki} C}{U(T))} K(a,x) e^{\frac{-E_i}{kT}} \right ] \right ) \end{aligned} $
where C is the concentration of the element in the sample.
Using the Taylor expansion:
$ \begin{aligned} e^x = \sum _{n=1}^\infty \frac{x^n}{n!} \end{aligned} $
gives
$\begin{aligned} I &= X e^{\frac{-(E_k - E_i)}{kT}} \left ( 1-\left [1- Y \frac{g_k A_{ki} C}{U(T)} K(a,x) e^{\frac{-E_i}{kT}} + \frac {1}{2} \left ( Y \frac{g_k A_{ki} C}{U(T)} K(a,x) e^{\frac{-E_i}{kT}}\right)^2 - \frac {1}{3!} \left ( Y \frac{g_k A_{ki} C}{U(T)} K(a,x) e^{\frac{-E_i}{kT}}\right)^3... \right ] \right ) \end{aligned} $
$\begin{aligned} = X e^{\frac{-(E_k - E_i)}{kT}} \left ( Y \frac{g_k A_{ki} C}{U(T)} K(a,x) e^{\frac{-E_i}{kT}} - \frac {1}{2} \left ( Y \frac{g_k A_{ki} C}{U(T)} K(a,x) e^{\frac{-E_i}{kT}}\right)^2 + \frac {1}{3!} \left ( Y \frac{g_k A_{ki} C}{U(T)} K(a,x) e^{\frac{-E_i}{kT}}\right)^3...\right ) \end{aligned} $
$\begin{aligned} =X Y \frac{g_k A_{ki} C}{U(T)} K(a,x) e^{\frac{-E_k}{kT}} - e^{\frac{-E_k}{kT}} e^{\frac{-E_i}{kT}}\left [ \frac {X}{2} \left ( Y \frac{g_k A_{ki} C}{U(T)} K(a,x) \right)^2 - \frac {1}{3!} \left ( Y \frac{g_k A_{ki} C}{U(T)} K(a,x) \right)^3 e^{\frac{-2E_i}{kT}} ...\right ] \end{aligned} $
The LIBS Equation
Under many circumstances (we will return to this statement later), we can ignore all but the first term in the expansion to give us the 'LIBS Equation'
$\begin{aligned} I = X Y \frac{g_k A_{ki} C}{U(T)} K(a,x) e^{\frac{-E_k}{kT}} = C \left ( X Y \right ) \left (g_k A_{ki} \right) \left (\frac{e^{\frac{-E_k}{kT}}} {U(T)} \right) K(a,x) \end{aligned} $
(where additional brackets have been added to group the terms).
Things to notice, the intensity of a peak in the LIBS spectra is:-
- directly (linearly) proportional to concentration of the element [first group]
- dependent on the properties of the collection system (spectrometer(s), optical fibres).
- different for each peak [third group]
- very sensitive (non-linearly proportional) to the temperature of the plasma. [fourth group]
Matrix Effects [or Energy Balance]
As can be seen from the 'LIBS Equation', determining the concentration of an element by measuring the intensity of peak only 'works' if everything after the concentration term remains constant across all the samples. Most LIBS experiments involve focussing a laser of fixed energy onto the sample, hence, the enery into the system is roughly constant. From the laser, the light:-
- travels through the optics
- is focussed onto the sample
- heats the sample through its phases (solid to liquid to gas to plasma)
with the energy 'left over' going to heat the plasma (that is, the T in the LIBS equation).
If any stage has significant variation:-
a) dirt on the optics, jitter in the laser energy, changes in beam cross shape
b) dust on the lens or between the lens and the sample (for example, material ejected during the previous analysis laser pulse)
c) different absorption of laser energy due to sample colour or transparency, different energy required to melt/boil sample (this last one is sometimes called 'matrix effects')
then the energy available to heat the plasma is different and the variation in the other terms is greater than due to the concentration and no chemical analysis is possible - given how sensitive the LIBS Equation is to the Temperature, it is sometimes a wonder that LIBS works as well as it does!!!!
Similarly, the different energies involved in absorption/melting/boiling/... are the reason that 1% Carbon in steel has a very different intensity to 1% Carbon in a geological sample which is very different to the intensity for 1% Carbon in Sea Water.....
Visualising LIBS Spectra
There are a number websites that will show the LIBS Spectra for a particular element. These all utilise some variant of the LIBS Equation above, with a database backend.
A far from exhaustive list of websites includes:-
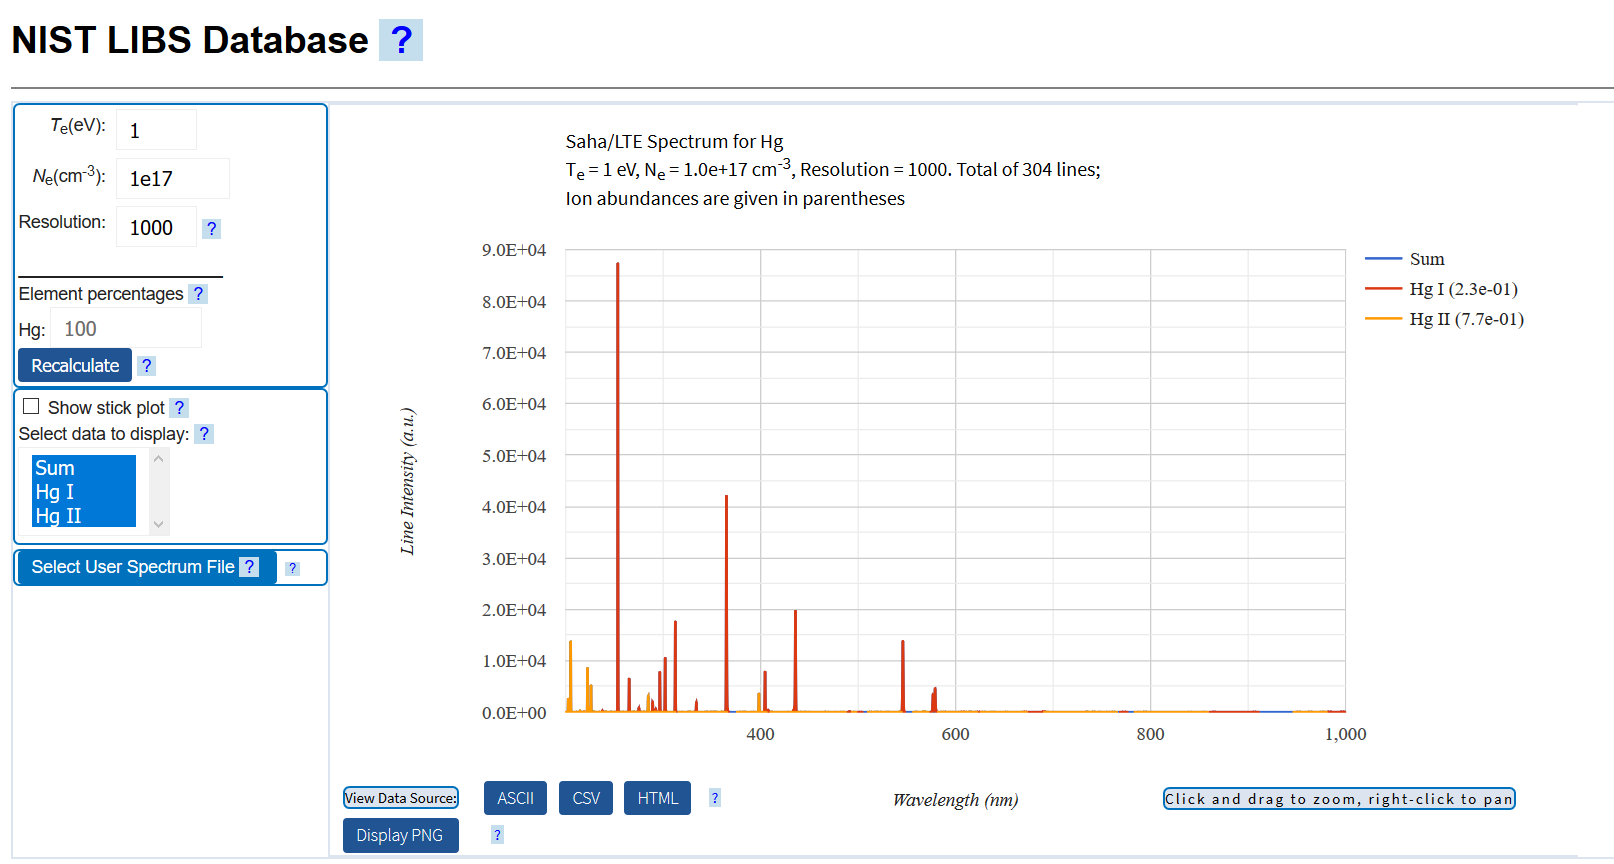 Here the spectra for a liquid, Mercury.
- LIBS-Info (click on an element in the periodic table to see the spectra)
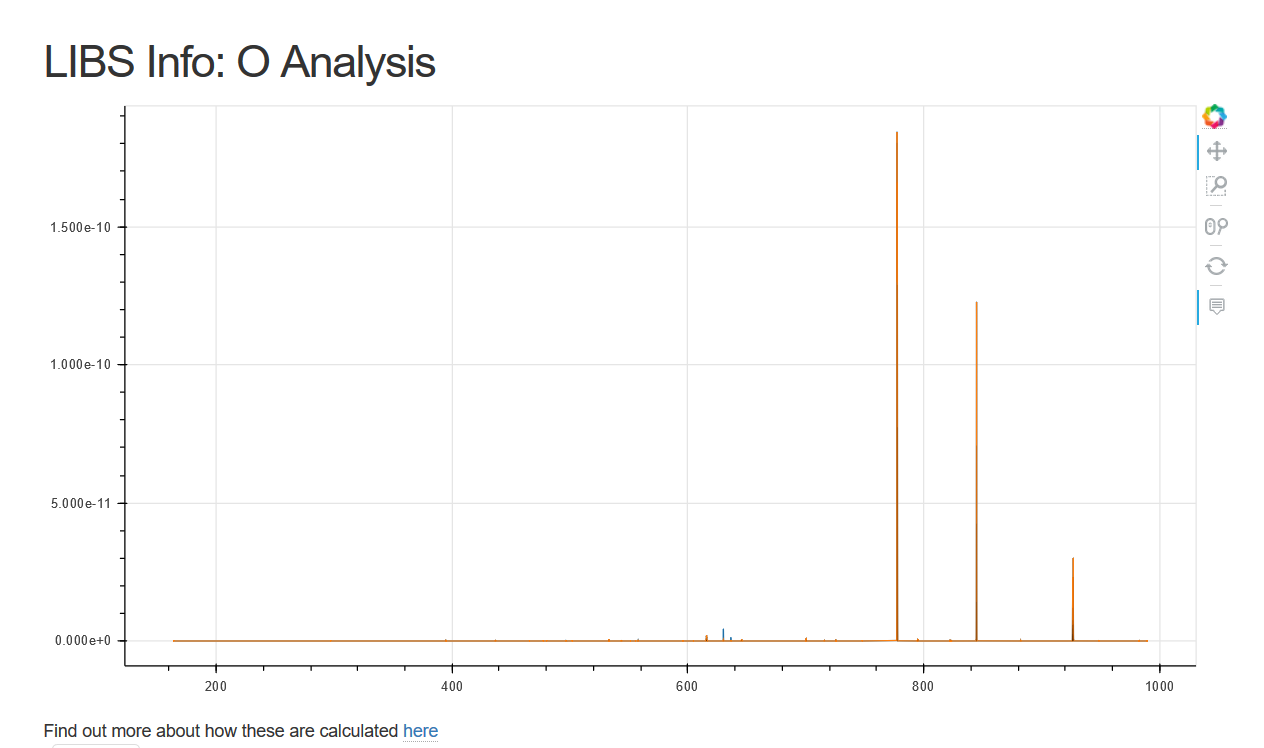 Here the spectra for a gas, Oxygen.
- AtomTrace
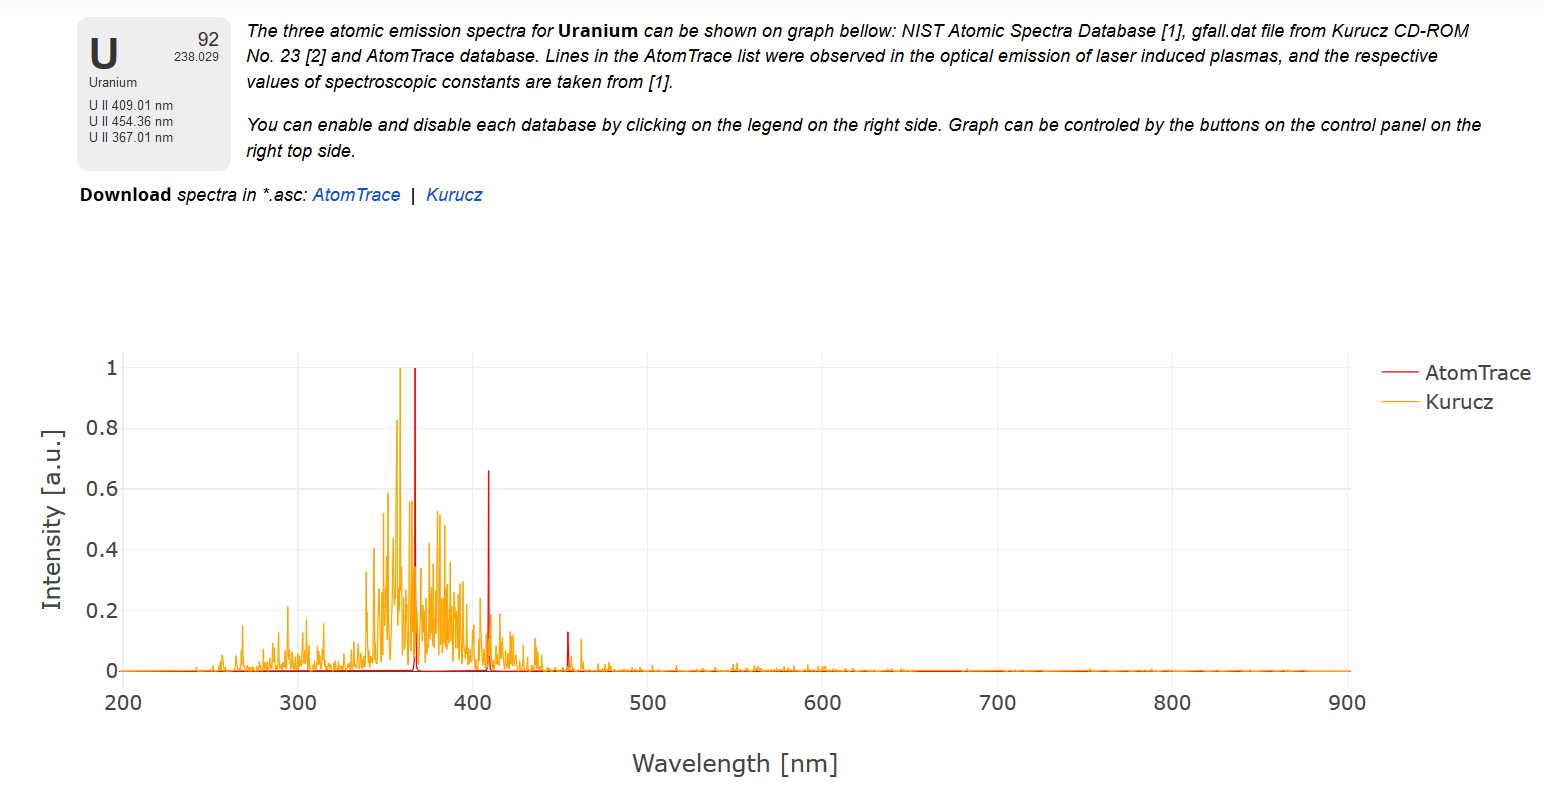 The Spectra for a solid, Uranium.
In the examples above, the spectra have become increasingly complex across the transition from gas to liquid to solid. However, this comes from the additional energy levels available from the increasingly larger atoms - the spectra of solid/frozen oxygen looks the same as the gas one.
Each Element has a unique spectra. This enables a skilled LIBS user to look at a spectra and state which elements are present in the sample.
In the next couple of Tutorials we will explore the basics of LIBS analysis using some common tools. The first one being a spreadsheet