LIBS Info: Understanding: What does the colour of the element boxes in the Periodic Table mean?
What does the colour of the element boxes in the Periodic Table mean?
The colour of the element boxes functions as an overview of the detection limit ranges for the element.
The box functions a bit like a "box and whisker plot", with the colours representing the percentiles.
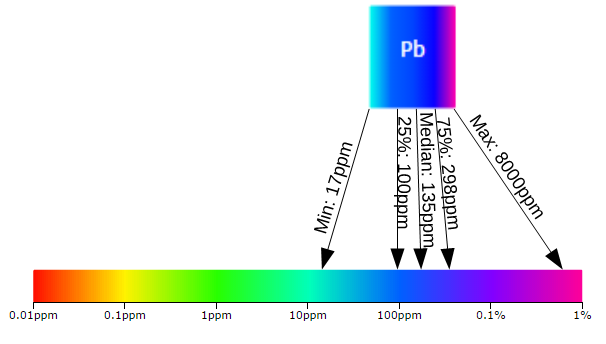
For example, at the time of this image the database listed 9 papers with detection limits for lead. The values were, in order, 17ppm, 22ppm, 100ppm, 100ppm, 135ppm, 150ppm, 298ppm, 300ppm and 8000ppm.
- The left side display the concentration colour for the minimum detection limit (the light blue of 17ppm)
- 25% across the box, the colour is the 25th percentile concentration (the dark blue of 100ppm)
- Middle of the box, the colour of the median concentration (the subtlely different blue of 135ppm)
- 75% across the box, the colour of the 75th percentile concentration (the imperceptibly different blue of 298ppm)
- The right side shows the concentration of the highest detection limit in the database (the purple of 8000ppm)
This way one can tell at a glance what the best, worst and likely detection limit for an element might be.